By Dr. Chad Penn,
Soil Scientist at National Soil Erosion Research Laboratory (USDA) and Adjunct Professor at Purdue University Adjunct Assistant Professor at Purdue University

What does P uptake have to do with other nutrients and how can too much phosphorus depress corn grain yield?
In the last post on this series concerning corn phosphorus (P) requirements, we explained how corn can experience “luxury consumption”, that is, uptake more P than it needs with no further benefit in grain yield. In some extreme cases, luxury P consumption can decrease yield. Similar to the last two posts on corn P needs (2023, 2021), this research was conducted in a sand-culture hydroponics system for the purpose of eliminating confounding interactions between the plant and soil, allowing us in this case to focus solely on the plant. In addition to P, we measured nutrient partitioning into various plant parts in order to explore how P uptake may have impacted that, and to determine if that could explain the yield decrease.
Previously, we showed that uptake of P beyond about 600 mg per plant could not further increase grain yield, and in fact, resulted in decreased yield. Here, we dive deeper into the non-P nutrient data to understand why grain yield suffered with excess P uptake. Throughout this discussion, “nutrient content” refers to the mass of the nutrient, not the concentration in the plant. For example, “grain N content” refers to the mass of the N in the grain only, while “total N content” refers to the total mass of N in the entire plant. In general, the response of non-P nutrients to P uptake can be placed in one of three categories:
Group 1 nutrients: grain nutrient content reached a plateau at the total P uptake value corresponding to the maximum grain yield, yet the total nutrient content of non-grain tissues continued with further P uptake (K, Mg, B, Mn; Figure 1)
Group 2 nutrients: grain nutrient content decreased at the P uptake value corresponding to maximum grain yield, while further uptake of these nutrients continued although it partitioned into non-grain plant parts (N, S, Fe; Figure 2)
Group 3 nutrients: grain nutrient content reached a plateau at the P uptake value corresponding to maximum grain yield, followed by a decrease in grain nutrient content, while the total content reached a maximum (Zn, Cu; Figure 3).
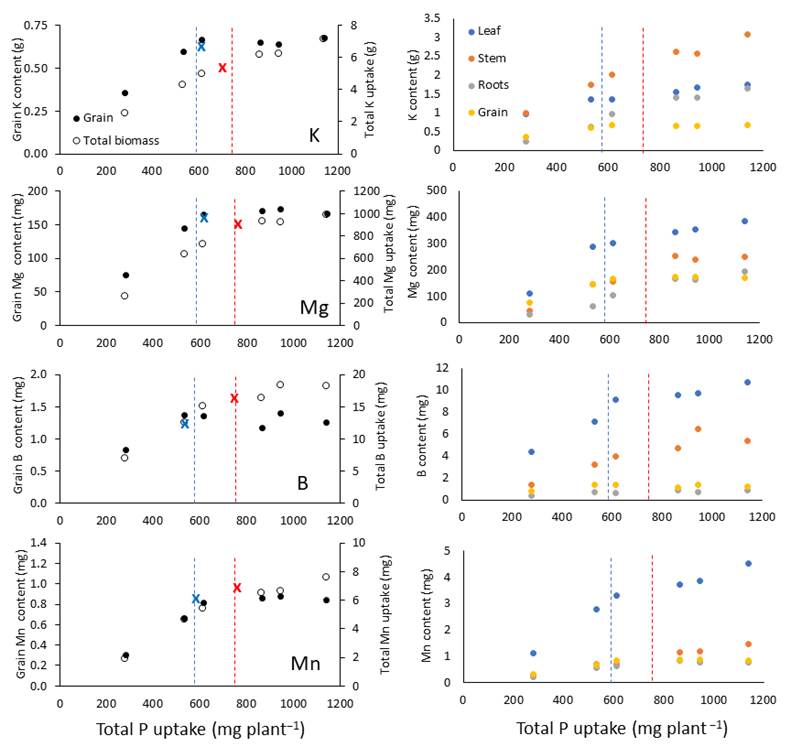
Figure 1. Potassium (K), magnesium (Mg), boron (B), and manganese (Mn) uptake and partitioning as a function of total phosphorus (P) uptake averaged over three maize cultivars and four replications. Dashed lines indicate total P uptake values where maximum grain yield (blue) and maximum biomass (red) were attained,580 and 730 mg P plant−1, respectively. Potassium, Mg, B, and Mn responded similarly, as each reached a plateau in grain nutrient content at the P uptake value corresponding to the maximum grain yield, yet total nutrient uptake continued with further P uptake. “X” marks the breakpoint where a statistically significant change in slope occurs for grain content (blue) and total uptake (red).
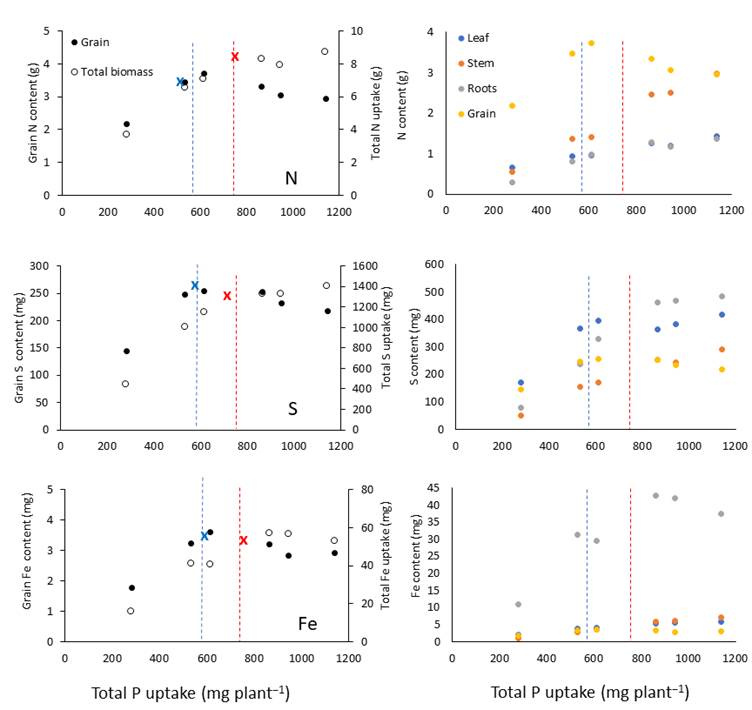
Figure 2. Nitrogen (N), sulfur (S), and iron (Fe) uptake and partitioning as a function of total phosphorus (P) uptake, averaged over three maize cultivars and four replications. Dashed lines indicate total P uptake values where maximum grain yield (blue) and biomass (red) were attained,580 and 730 mg P plant−1, respectively. Grain content and total uptake of N, S, and Fe grouped together as each decreased after reaching a plateau at the P uptake value corresponding with the maximum grain yield (blue line), yet total nutrient content increased in other plant parts with further P uptake. “X” marks the breakpoint where a statistically significant change in the slope occurs for grain content (blue) and total uptake (red).
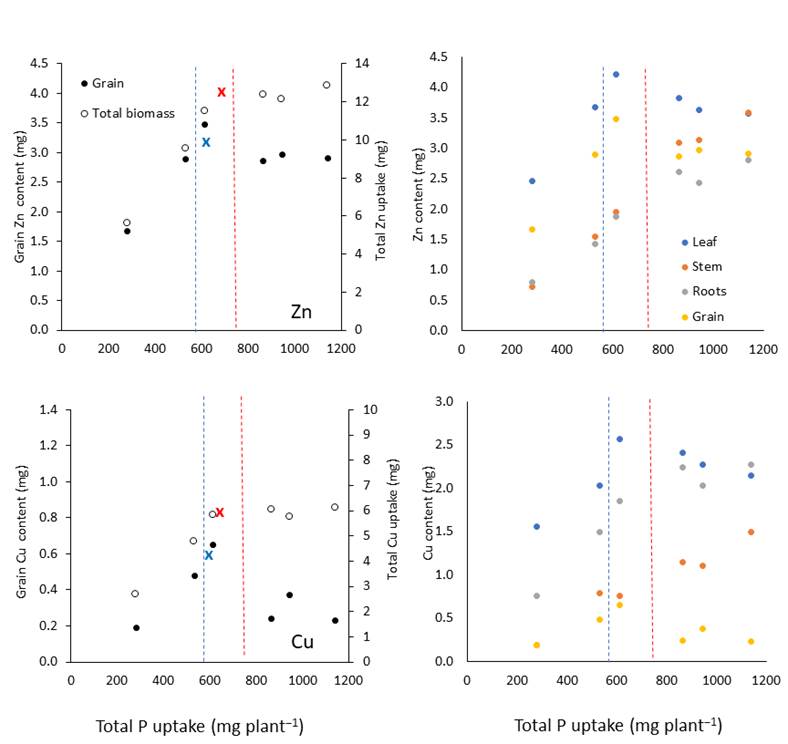
Figure 3. Zinc (Zn) and copper (Cu) uptake and partitioning as a function of total phosphorus (P) uptake averaged over three maize cultivars and four replications. Dashed lines indicate the total P uptake values where maximum grain yield (blue) and biomass (red) were attained,580 and 730 mg P plant−1, respectively. Grain content and total uptake of Zn and Cu grouped together as each decreased after reaching a plateau at the P uptake value corresponding with maximum grain yield (blue line), and no further total uptake occurred with further P uptake. “X” marks the breakpoint where a statistically significant change in the slope occurs for grain content (blue) and total uptake (red).
Initially, nutrient content in all plant parts increased with increased P uptake. This is because P uptake enabled vigorous plant growth, which requires further uptake of non-P nutrients for building biomass and performing various plant functions i.e. building a bigger factory requires more construction materials. However, after maximum grain yield was achieved with an uptake of 580 mg P, there were subtle differences in the behavior of nutrients in the three different categories as P uptake continued increasing.
Group 1 nutrients (Figure 1) reached their max grain content coinciding with max grain yield and optimum P uptake, yet continued to increase content in different plant parts with further P uptake before eventually reaching a plateau in total nutrient content. Group 2 nutrients (N, S, and Fe; Figure 2) were similar to Group 1, except that after maximum grain yield was attained with 580 mg P uptake, further P uptake beyond that level resulted in less nutrient being deposited in the grain i.e. grain nutrient content significantly decreased although total nutrient content continued to increase for a time. With luxury P consumption, less N, S, and Fe were moving into grain and instead moving into other plant parts. Group 3 nutrients (Cu, Zn; Figure 3) were a more extreme version of Group 2. Not only did nutrient content of the grain decrease when P uptake exceeded 580 mg and max yield, but total uptake of those nutrients no longer increased as was observed in Group 2.
Nitrogen and S content in grain is primarily associated with protein. While Cu and Zn are not components of protein, they are considered “co-factors” because they are required for making amino acids that proteins comprise. It appeared that with luxury P consumption, Cu and Zn became tied up with excess P in the roots. Excess P has been hypothesized to reduce Zn and Cu uptake, either as Zn and Cu phosphates in the soil, or tied up in the roots as Zn and Cu phytate, preventing translocation to the grain during the grain-fill process. But in this case, we have an inert media, not soil, so the Cu and Zn must have been tied up in the roots. Indeed, the nutrient partitioning data supported this. With less Cu and Zn in the grain for making protein, the N and S contents of the grain, which are components of protein, are inhibited and result in a lesser grain mass i.e. less grain yield. Less protein, less yield. We have observed this same phenomenon in soybean.
So how could excess P uptake decrease grain yield yet still increase further biomass production? We hypothesize that grain development is more limited by Cu and Zn than in development of other plant parts.
Does excess P uptake cause a reduced yield due to poor Cu and Zn translocation in the field? There have been some hints of this in the older literature, but theoretically, it would only occur in extreme situations: extremely high soil test P levels coupled with limited labile Cu and Zn.
For details on this study, please see the citations below:
Penn, C. J., Camberato, J. J., & Wiethorn, M. A. (2022). How much phosphorus uptake is required for achieving maximum maize grain yield? part 1: luxury consumption and implications for yield. Agronomy, 13(1), 95.
Penn, C. J., Camberato, J. J., & Wiethorn, M. A. (2023). How much phosphorus uptake is required for achieving maximum maize grain yield? part 2: impact of phosphorus uptake on grain quality and partitioning of nutrients. Agronomy, 13(1), 258.